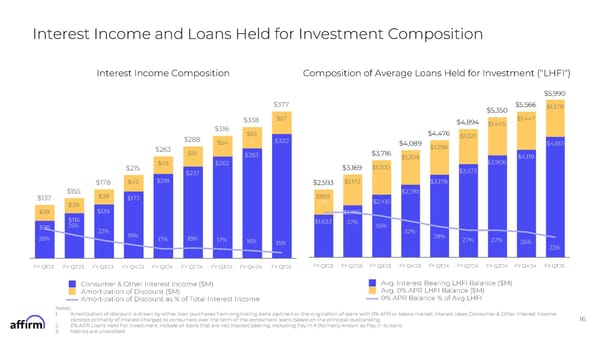
Interest Income and Loans Held for Investment Composition Interest Income Composition Composition of Average Loans Held for Investment ("LHFI") $5,990 $377 $5,566 $1,378 $5,350 $57 $1,447 $338 $4,894 $1,445 $316 $4,476 $55 $1,321 $288 $320 $54 $4,613 $4,089 $1,298 $263 $51 $3,716 $283 $4,119 $1,309 $3,906 $45 $262 $1,300 $3,169 $215 $3,573 $237 $218 $1,172 $3,178 $42 $178 $2,593 $155 $2,781 $39 $959 $173 $137 $2,415 37% $39 $139 $39 $1,996 $116 $1,633 37% 25% 35% $98 22% 32% 19% 29% 28% 18% 17% 17% 27% 27% 16% 26% 15% 23% FY Q1'23 FY Q2'23 FY Q3'23 FY Q4'23 FY Q1'24 FY Q2'24 FY Q3'24 FY Q4'24 FY Q1'25 FY Q1'23 FY Q2'23 FY Q3'23 FY Q4'23 FY Q1'24 FY Q2'24 FY Q3'24 FY Q4'24 FY Q1'25 Avg. Interest Bearing LHFI Balance ($M) Consumer & Other Interest Income ($M) Avg. 0% APR LHFI Balance ($M) Amortization of Discount ($M) 0% APR Balance % of Avg LHFI Amortization of Discount as % of Total Interest Income Notes: 1. Amortization of discount is driven by either loan purchases from originating bank partners or the origination of loans with 0% APR or below market interest rates; Consumer & Other Interest Income 16 consists primarily of interest charged to consumers over the term of the consumers9 loans based on the principal outstanding 2. 0% APR Loans Held For Investment include all loans that are not interest bearing, including Pay in X (formerly known as Pay in 4) loans 3. Metrics are unaudited
 FY Q1'25 Earnings Supplement Page 15 Page 17