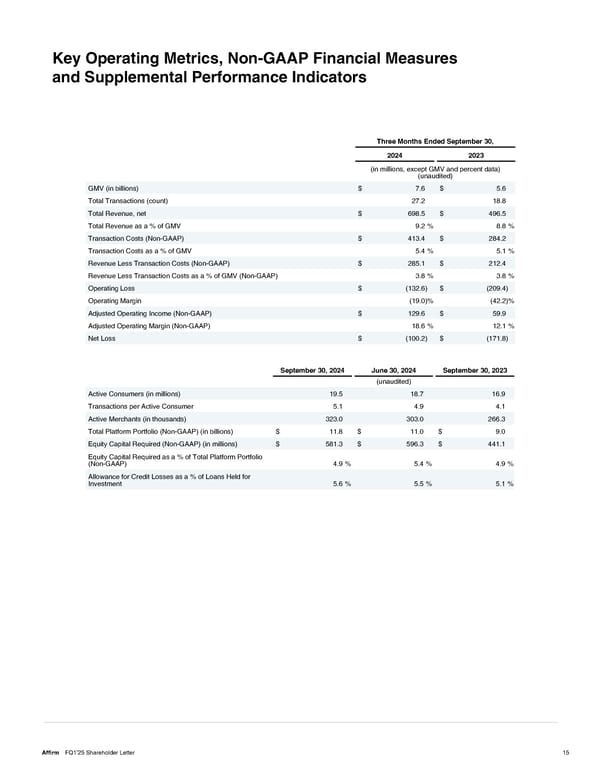
Key Operating Metrics, Non-GAAP Financial Measures and Supplemental Performance Indicators Three Months Ended September 30, 2024 2023 (in millions, except GMV and percent data) (unaudited) GMV (in billions) $ 7.6 $ 5.6 Total Transactions (count) 27.2 18.8 Total Revenue, net $ 698.5 $ 496.5 Total Revenue as a % of GMV 9.2 % 8.8 % Transaction Costs (Non-GAAP) $ 413.4 $ 284.2 Transaction Costs as a % of GMV 5.4 % 5.1 % Revenue Less Transaction Costs (Non-GAAP) $ 285.1 $ 212.4 Revenue Less Transaction Costs as a % of GMV (Non-GAAP) 3.8 % 3.8 % Operating Loss $ (132.6) $ (209.4) Operating Margin (19.0) % (42.2) % Adjusted Operating Income (Non-GAAP) $ 129.6 $ 59.9 Adjusted Operating Margin (Non-GAAP) 18.6 % 12.1 % Net Loss $ (100.2) $ (171.8) September 30, 2024 June 30, 2024 September 30, 2023 (unaudited) Active Consumers (in millions) 19.5 18.7 16.9 Transactions per Active Consumer 5.1 4.9 4.1 Active Merchants (in thousands) 323.0 303.0 266.3 Total Platform Portfolio (Non-GAAP) (in billions) $ 11.8 $ 11.0 $ 9.0 Equity Capital Required (Non-GAAP) (in millions) $ 581.3 $ 596.3 $ 441.1 Equity Capital Required as a % of Total Platform Portfolio (Non-GAAP) 4.9 % 5.4 % 4.9 % Allowance for Credit Losses as a % of Loans Held for Investment 5.6 % 5.5 % 5.1 % Affirm FQ1’25 Shareholder Letter 15
 Shareholder Letter Page 14 Page 16