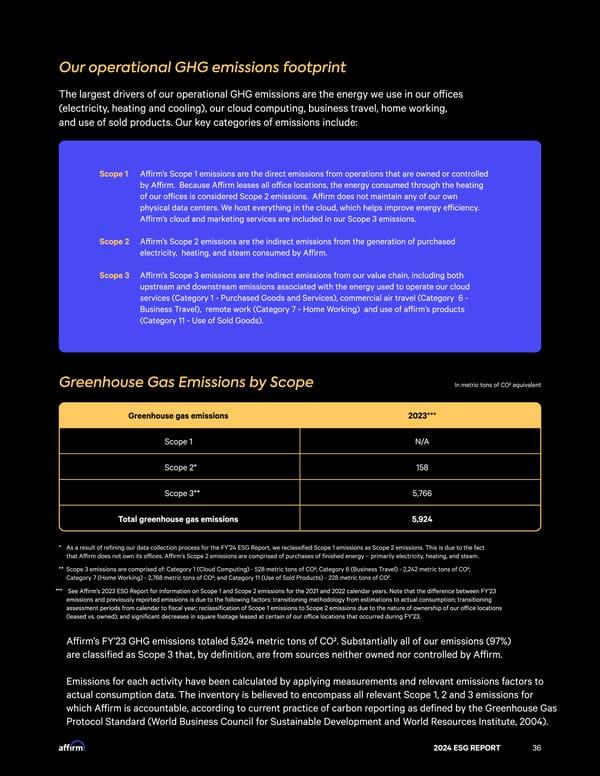
Our operational GHG emissions footprin縀 The largest drivers of our operational GHG emissions are the energy we use in our o昀昀ices (electricity, heating and cooling), our cloud computing, business travel, home working, and use of sold products. Our key categories of emissions include: Scope ‼㱏 A昀昀irm’s Scope 1 emissions are the direct emissions from operations that are owned or controlled by A昀昀irm. Because A昀昀irm leases all o昀昀ice locations, the energy consumed through the heating of our o昀昀ices is considered Scope 2 emissions. A昀昀irm does not maintain any of our own physical data centers. We host everything in the cloud, which helps improve energy e昀昀iciency. A昀昀irm’s cloud and marketing services are included in our Scope 3 emissions.ꨀ Scope 㰀᐀ A昀昀irm’s Scope 2 emissions are the indirect emissions from the generation of purchased electricity, heating, and steam consumed by A昀昀irm㠀 Scope 㴀 A昀昀irm’s Scope 3 emissions are the indirect emissions from our value chain, including both upstream and downstream emissions associated with the energy used to operate our cloud services (Category 1 - Purchased Goods and Services), commercial air travel (Category 6 - Business Travel), remote work (Category 7 - Home Working) and use of a昀昀irm’s products (Category 11 - Use of Sold Goods). Greenhouse Gas Emissions by Scope In metric tons of CO2 equivalent Greenhouse gas emissions 2023*** Scope 1 N/A Scope 2* 158 Scope 3** 5,766 Total greenhouse gas emissions 5,924 * As a result of refining our data collection process for the FY’24 ESG Report, we reclassified Scope 1 emissions as Scope 2 emissions. This is due to the fact that A昀昀irm does not own its o昀昀ices. A昀昀irm’s Scope 2 emissions are comprised of purchases of finished energy – primarily electricity, heating, and steam. ****** Scope 3 emissions are comprised of: Category 1 (Cloud Computing) - 528 metric tons of CO2; Category 6 (Business Travel) - 2,242 metric tons of CO2; Category 7 (Home Working) - 2,768 metric tons of CO2; and Category 11 (Use of Sold Products) - 228 metric tons of CO2. *** See A昀昀irm’s 2023 ESG Report for information on Scope 1 and Scope 2 emissions for the 2021 and 2022 calendar years. Note that the di昀昀erence between FY’23 emissions and previously reported emissions is due to the following factors: transitioning methodology from estimations to actual consumption; transitioning assessment periods from calendar to fiscal year; reclassification of Scope 1 emissions to Scope 2 emissions due to the nature of ownership of our o昀昀ice locations (leased vs. owned); and significant decreases in square footage leased at certain of our o昀昀ice locations that occurred during FY’23. A昀昀irm’s FY’23 GHG emissions totaled 5,924 metric tons of CO2. Substantially all of our emissions (97%⤠⠀ are classified as Scope 3 that, by definition, are from sources neither owned nor controlled by A昀昀irm.ꨀ Emissions for each activity have been calculated by applying measurements and relevant emissions factors to actual consumption data. The inventory is believed to encompass all relevant Scope 1, 2 and 3 emissions for which A昀昀irm is accountable, according to current practice of carbon reporting as defined by the Greenhouse Gas Protocol Standard (World Business Council for Sustainable Development and World Resources Institute, 2004). 2024 ESG REPORT 36
 2024 ESG Report Page 35 Page 37