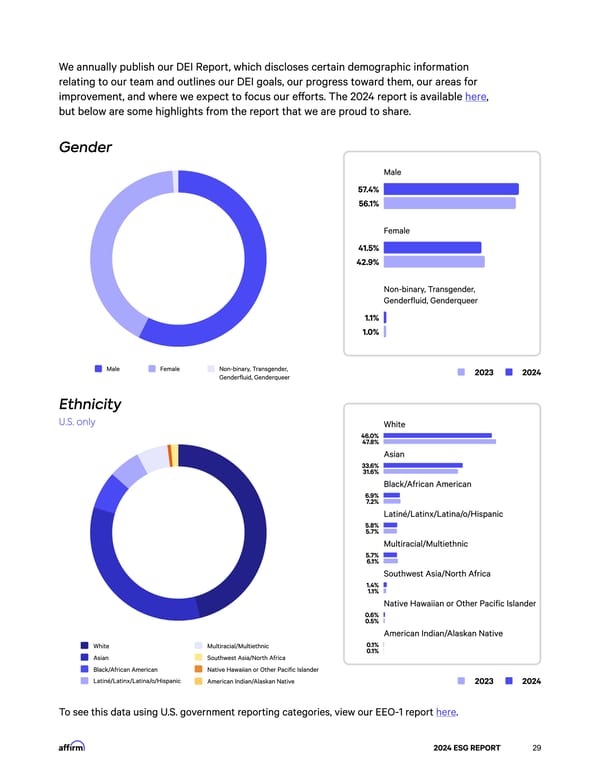
We annually publish our DEI Report, which discloses certain demographic information relating to our team and outlines our DEI goals, our progress toward them, our areas for here improvement, and where we expect to focus our e昀昀orts. The 2024 report is available , but below are some highlights from the report that we are proud to share. Gender Male 57.4% 56.1% Female 41.5% 42.9% Non-binary, Transgender,†⠀ Genderfluid, Genderqueer 1.1% 1.0% Male Female Non-binary, Transgender,†⠀ 2023 2024 Genderfluid, Genderqueer Ethnicit礀 U.S. only White 46.0% 47.8% Asian 33.6% 31.6% Black/African American 6.9% 7.2% Latiné/Latinx/Latina/o/Hispanic 5.8% 5.7% Multiracial/Multiethnic 5.7% 6.1% Southwest Asia/North Africa 1.4% 1.1% Native Hawaiian or Other Pacific Islander 0.6% 0.5% American Indian/Alaskan Native 0.1% White Multiracial/Multiethnic 0.1% Asian Southwest Asia/North Africa Black/African American Native Hawaiian or Other Pacific Islander Latiné/Latinx/Latina/o/Hispanic American Indian/Alaskan Native 2023 2024 To see this data using U.S. government reporting categories, view our EEO-1 report here. 2024 ESG REPORT 29
 2024 ESG Report Page 28 Page 30