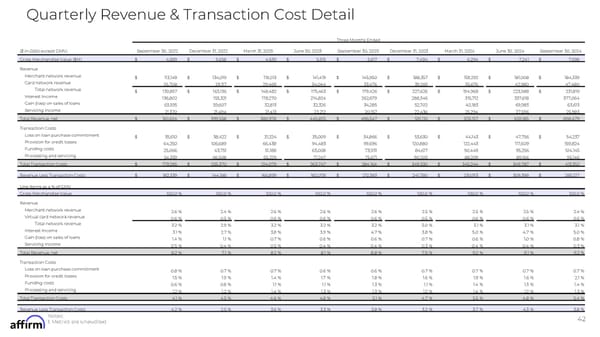
Quarterly Revenue & Transaction Cost Detail Three Months Ended ($ in 000s except GMV) September 30, 2022 December 31, 2022 March 31, 2023 June 30, 2023 September 30, 2023 December 31, 2023 March 31, 2024 June 30, 2024 September 30, 2024 Gross Merchandise Value ($M) $ 4,389 $ 5,658 $ 4,639 $ 5,515 $ 5,617 $ 7,494 $ 6,294 $ 7,241 $ 7,598 Revenue Merchant network revenue $ 113,149 $ 134,019 $ 119,013 $ 141,419 $ 145,950 $ 188,357 $ 159,292 $ 181,008 $ 184,339 Card network revenue 26,708 29,117 29,469 34,044 33,476 39,269 35,676 42,980 47,480 Total network revenue $ 139,857 $ 163,136 $ 148,482 $ 175,463 $ 179,426 $ 227,626 $ 194,968 $ 223,988 $ 231,819 Interest income 136,802 155,321 178,270 214,824 262,679 288,346 315,712 337,618 377,064 Gain (loss) on sales of loans 63,595 59,607 32,813 32,326 34,285 52,702 40,183 69,983 63,613 Servicing income 21,370 21,494 21,413 23,212 20,157 22,436 25,294 27,596 25,983 Total Revenue, net $ 361,624 $ 399,558 $ 380,978 $ 445,825 $ 496,547 $ 591,110 $ 576,157 $ 659,185 $ 698,479 Transaction Costs Loss on loan purchase commitment $ 35,610 $ 38,422 $ 31,224 $ 35,009 $ 34,866 $ 53,630 $ 44,143 $ 47,756 $ 54,237 Provision for credit losses 64,250 106,689 66,438 94,483 99,696 120,880 122,443 117,609 159,824 Funding costs 25,066 43,751 51,188 63,008 73,931 84,617 90,449 95,256 104,145 Processing and servicing 54,359 66,508 65,229 71,247 75,671 90,203 88,209 89,166 95,146 Total Transaction Costs $ 179,285 $ 255,370 $ 214,079 $ 263,747 $ 284,164 $ 349,330 $ 345,244 $ 349,787 $ 413,352 Revenue Less Transaction Costs $ 182,339 $ 144,188 $ 166,899 $ 182,078 $ 212,383 $ 241,780 $ 230,913 $ 309,398 $ 285,127 Line Items as a % of GMV Gross Merchandise Value 100.0 % 100.0 % 100.0 % 100.0 % 100.0 % 100.0 % 100.0 % 100.0 % 100.0 % Revenue Merchant network revenue 2.6 % 2.4 % 2.6 % 2.6 % 2.6 % 2.5 % 2.5 % 2.5 % 2.4 % Virtual card network revenue 0.6 % 0.5 % 0.6 % 0.6 % 0.6 % 0.5 % 0.6 % 0.6 % 0.6 % Total network revenue 3.2 % 2.9 % 3.2 % 3.2 % 3.2 % 3.0 % 3.1 % 3.1 % 3.1 % Interest income 3.1 % 2.7 % 3.8 % 3.9 % 4.7 % 3.8 % 5.0 % 4.7 % 5.0 % Gain (loss) on sales of loans 1.4 % 1.1 % 0.7 % 0.6 % 0.6 % 0.7 % 0.6 % 1.0 % 0.8 % Servicing income 0.5 % 0.4 % 0.5 % 0.4 % 0.4 % 0.3 % 0.4 % 0.4 % 0.3 % Total Revenue, net 8.2 % 7.1 % 8.2 % 8.1 % 8.8 % 7.9 % 9.2 % 9.1 % 9.2 % Transaction Costs Loss on loan purchase commitment 0.8 % 0.7 % 0.7 % 0.6 % 0.6 % 0.7 % 0.7 % 0.7 % 0.7 % Provision for credit losses 1.5 % 1.9 % 1.4 % 1.7 % 1.8 % 1.6 % 1.9 % 1.6 % 2.1 % Funding costs 0.6 % 0.8 % 1.1 % 1.1 % 1.3 % 1.1 % 1.4 % 1.3 % 1.4 % Processing and servicing 1.2 % 1.2 % 1.4 % 1.3 % 1.3 % 1.2 % 1.4 % 1.2 % 1.3 % Total Transaction Costs 4.1 % 4.5 % 4.6 % 4.8 % 5.1 % 4.7 % 5.5 % 4.8 % 5.4 % Revenue Less Transaction Costs 4.2 % 2.5 % 3.6 % 3.3 % 3.8 % 3.2 % 3.7 % 4.3 % 3.8 % Notes: 42 1. Metrics are unaudited
 FY Q1'25 Earnings Supplement Page 41 Page 43