
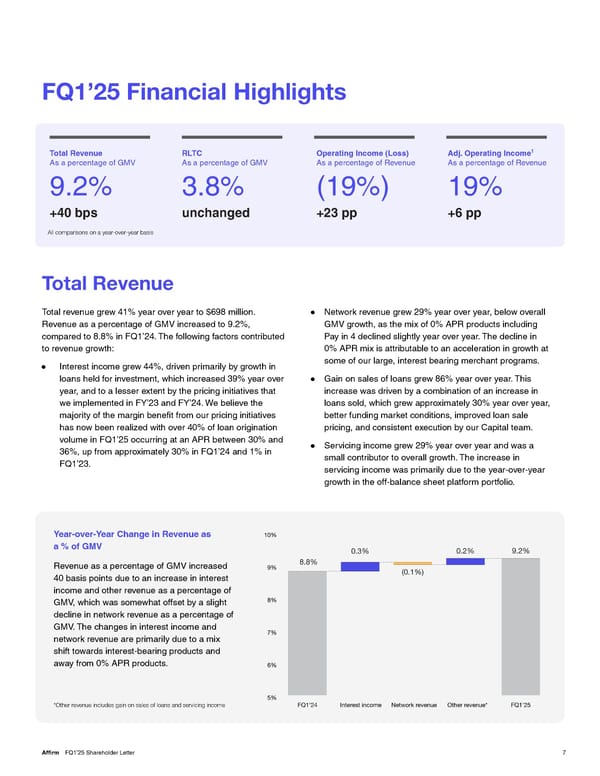
FQ1’25 Financial Highlights 1 Total Revenue RLTC Operating Income (Loss) Adj. Operating Income As a percentage of GMV As a percentage of GMV As a percentage of Revenue As a percentage of Revenue 9.2% 3.8% (19%) 19% +40 bps unchanged +23 pp +6 pp All comparisons on a year-over-year basis Total Revenue Total revenue grew 41% year over year to $698 million. ● Network revenue grew 29% year over year, below overall Revenue as a percentage of GMV increased to 9.2%, GMV growth, as the mix of 0% APR products including compared to 8.8% in FQ1’24. The following factors contributed Pay in 4 declined slightly year over year. The decline in to revenue growth: 0% APR mix is attributable to an acceleration in growth at some of our large, interest bearing merchant programs. ● Interest income grew 44%, driven primarily by growth in loans held for investment, which increased 39% year over ● Gain on sales of loans grew 86% year over year. This year, and to a lesser extent by the pricing initiatives that increase was driven by a combination of an increase in we implemented in FY’23 and FY’24. We believe the loans sold, which grew approximately 30% year over year, majority of the margin beneût from our pricing initiatives better funding market conditions, improved loan sale has now been realized with over 40% of loan origination pricing, and consistent execution by our Capital team. volume in FQ1’25 occurring at an APR between 30% and ● Servicing income grew 29% year over year and was a 36%, up from approximately 30% in FQ1’24 and 1% in small contributor to overall growth. The increase in FQ1’23. servicing income was primarily due to the year-over-year growth in the off-balance sheet platform portfolio. Year-over-Year Change in Revenue as a % of GMV Revenue as a percentage of GMV increased 40 basis points due to an increase in interest income and other revenue as a percentage of GMV, which was somewhat offset by a slight decline in network revenue as a percentage of GMV. The changes in interest income and network revenue are primarily due to a mix shift towards interest-bearing products and away from 0% APR products. *Other revenue includes gain on sales of loans and servicing income Affirm FQ1’25 Shareholder Letter 7
 Shareholder Letter Page 6 Page 8